If you manage a nitrogen generation system, you watch the energy bill. You track filter changes and service schedules. But what if your largest cost category is invisible, systematically baked into your setup and operations?
This isn’t about a faulty valve or an aging compressor. This is about silent, sanctioned waste—design compromises, operational mismatches, and accepted practices that together levy a relentless “hidden tax” on your nitrogen supply. You pay it every hour, in elevated energy draw, excessive wear, and lost capacity.
This guide moves beyond simple kWh metrics. It provides a framework to shift your perspective from maintaining equipment to optimizing a system, empowering you to identify and challenge this hidden tax yourself.
I. The Efficiency Illusion: Nominal vs. Effective Flow
Your generator is rated for, say, 100 Nm³/h at 99.5% purity. That’s its nominal capacity. But what matters to your process and your pocket is the effective flow—the usable gas that reaches your point of use, at the required purity and pressure, without disproportionate cost.
The gap between these two numbers is your hidden tax. It’s consumed by three primary systemic inefficiencies.
II. The Three Sources of Your Hidden Tax
1. The Pressure Premium
- The Problem: Your application requires 5 bar. To ensure this at the farthest point, you set the generator outlet at 6.5 bar. This pressure premium forces the entire system—compressor, dryer, generator—to work against a higher backpressure, increasing energy consumption by ~7% for every extra bar, not to mention increasing leakage rates.
- The Question to Ask: “What is the minimum stable pressure my critical application needs, and can we tier pressure zones in the plant?”
【Typical Scenario】A food packaging line running its entire nitrogen network at 7 bar to satisfy one single machine needing 6.5 bar, incurring over 15% higher energy costs than necessary.
2. The Load Mismatch Penalty
- The Problem: PSA and membrane generators have an optimal efficiency point, typically at 80-100% load. Running consistently below 50% load (common in oversized or multi-shift operations) drastically increases your cost per unit nitrogen. The machine consumes disproportionate energy and compressed air for the gas produced.
- The Question to Ask: “What does my generator’s actual flow profile look like over a week? How much time is spent in low-load, high-cost operation?”
【Typical Scenario】A job-shop metal fabricator with a 100 Nm³/h generator running at 30% average load, resulting in a true CPU nearly 40% higher than if it operated at 80% load with a properly sized unit.
3. The Purge & Purification Overhead
- The Problem: This is non-negotiable consumption, but is it optimized? For PSA systems, the regeneration purge gas (often 15-25% of output) is a fixed cost of operation. For membrane systems, the continuous enriched oxygen vent represents lost compressed air. Inefficient pre-filtration (clogged filters) or poor inlet air quality forces these systems to work harder, increasing this overhead.
- The Question to Ask: “Is my purge/vent flow aligned with the manufacturer’s spec for my current conditions? Is my air prep ensuring the lowest possible purification burden?”
【Typical Scenario】A PSA system with oil-contaminated inlet air, causing the carbon molecular sieve to lose 30% of its capacity and forcing purge cycles to double in frequency to maintain purity, effectively wasting 20% more compressed air.
III. The Self-Audit Framework: From Data to Insight
You don’t need a proprietary checklist. You need a thinking framework. Follow these four steps to build your own analysis.
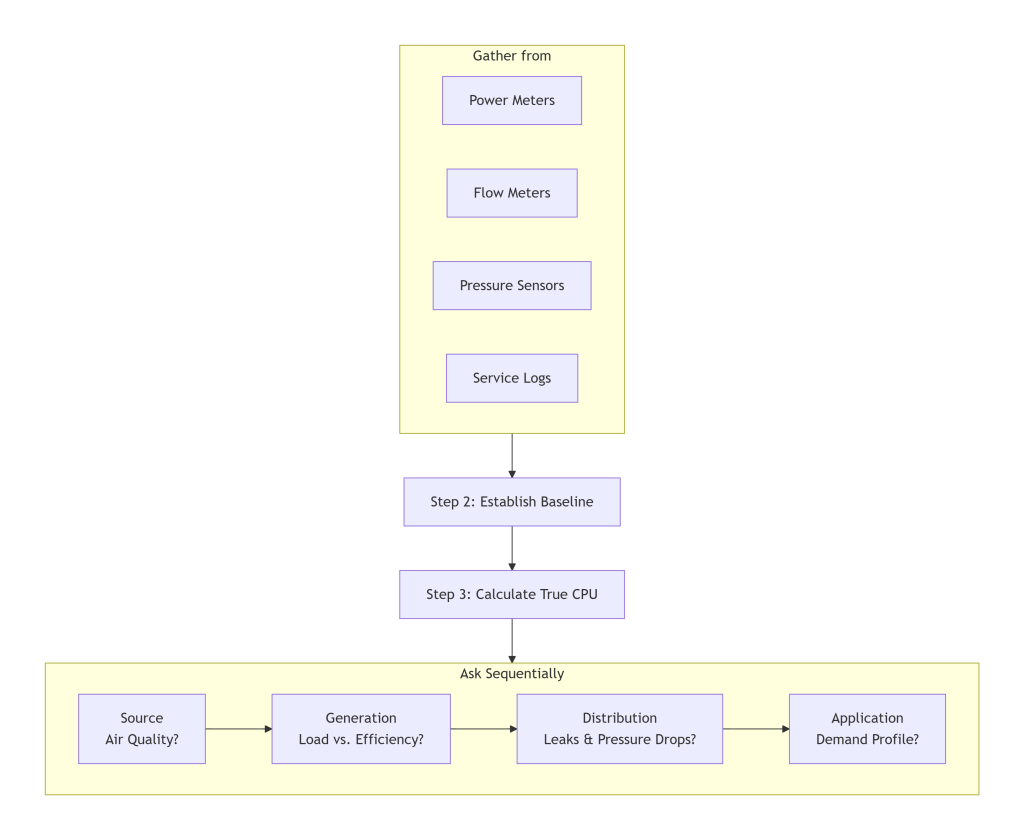
Step 1: Data Mapping – What to Measure
Identify sources for four key data streams over a representative period (e.g., one week):
- Total Energy Input: Main power to the compressor and generator.
- Total Nitrogen Output: Flow meter data (corrected for pressure/temperature).
- Key Pressure Points: At the compressor outlet, dryer inlet, generator inlet, and main distribution header.
- Operational Logs: Generator on/off cycles, purity readings, maintenance events.
Step 2: Establish a Performance Baseline
Don’t chase a theoretical ideal. Create a practical baseline:
- Use the manufacturer’s specific energy consumption (kWh/Nm³)—the unit energy use listed on the spec sheet—at your average operating load as one reference.
- Alternatively, use a period of smooth, trouble-free operation from your own history as a “golden batch” baseline for comparison.
Step 3: Calculate Your True Cost Per Unit (CPU)
Move beyond electricity cost. Use this formula for a more holistic view:
Total System Cost = Energy Cost + Maintenance Cost + Consumables Cost + Depreciation
True CPU = Total System Cost / Total Nitrogen Output (Nm³)
- Energy Cost: From your meter data.
- Maintenance & Consumables: Annualized cost of filters, desiccant, parts.
- Depreciation: A simple annual allocation of the equipment’s purchase cost over its lifespan (e.g., a $100k machine over 10 years = $10k/year).
This number is your key performance indicator. Track its trend. (Tip: Compare it to the manufacturer’s rated specific energy consumption as a starting benchmark.)
Step 4: The Diagnostic Questioning Tree
When your true CPU rises, don’t jump to component failure. Ask in sequence:
- Source: Has inlet air temperature or quality changed? Are pre-filters overdue?
- Generation: Is the generator operating far from its optimal load? Has purge consumption crept up?
- Distribution: Are there new, unaccounted-for leaks? Has system pressure drifted upward?
- Application: Have production schedules or demand patterns shifted?
This structured questioning isolates the problem domain, preventing wasted effort.
Conclusion: From Passive Consumer to Active Manager
The goal is not to become an expert in nitrogen generation engineering. The goal is to develop informed oversight—the ability to ask the right questions, interpret the answers, and make decisions that align operational practice with economic and technical reality.
By applying this framework, you transform your nitrogen supply from a black-box utility into a transparent, manageable process asset. You shift from paying the hidden tax to auditing—and ultimately reducing—it.
At MINNUO, we design systems for efficiency at the component level. But our greater value lies in partnering with engineers who think in systems. We provide not just the machine, but the contextual understanding and support that turns a high-specification generator into a genuinely low-cost nitrogen source. Because true efficiency is measured not at the outlet valve, but on the bottom line.


 sales2:+86 17506119168