
Select a food packaging membrane nitrogen generator from the required package residual oxygen and peak gas demand. Calculate flow using package headspace, maximum line speed, gas-exchange ratio, and the number of lines running simultaneously. Then compare residual O₂, air-to-nitrogen ratio, pressure, and kWh/Nm³ N₂.
Why Is Nitrogen Purity Alone Not Enough for Food Packaging?
Generator purity is an input specification; residual oxygen in the sealed package is the final process result.
Three issues commonly affect performance:
- Generator purity and package oxygen are treated as the same value.
A 99% N₂ supply typically contains about 1% residual oxygen. The package may also contain trapped air, porous products, poorly swept corners, and oxygen entering through the seal or packaging film. - The generator is sized from average consumption.
Simultaneous line starts, film changes, and vacuum-backfill cycles can create demand peaks well above hourly average flow. - Nitrogen purity is higher than the process requires.
Raising membrane nitrogen purity generally reduces product-gas flow and increases compressed-air consumption. The purity specification should match the food’s oxidation sensitivity, gas recipe, and shelf-life target.
Under 21 CFR 184.1540, nitrogen used in food must have a purity suitable for its intended use and be applied according to current good manufacturing practice. In the EU, nitrogen is authorized as food additive E941 at quantum satis. The final gas specification depends on the food, microbial risks, film permeability, and required shelf life.

How Much Nitrogen Does a Food Packaging Line Need?
Continuous gas-flush equipment can be sized from package volume and maximum line speed. Vacuum-backfill machines are better calculated from gas consumption per cycle.
What Is the Flow Formula for Continuous Gas Flushing?
For flow wrappers, vertical form-fill-seal machines, and similar continuous-flush equipment:
| Variable | Meaning | Unit |
|---|---|---|
| Effective gas volume replaced in each package | L/package | |
| Maximum packaging speed | packages/min | |
| Gas-exchange ratio | — | |
| Lines operating simultaneously | lines | |
| Peak-demand, leakage, and expansion factor; commonly 1.10–1.25 for preliminary sizing | — | |
| Peak nitrogen demand | Nm³/h |
Vacuum-backfill tray sealers, multiple-evacuation systems, and intermittent packaging machines are normally sized using the machine manufacturer’s NL/cycle value.
How Does Supply Oxygen Affect Package Residual Oxygen?
For an ideal, perfectly mixed package:
Rearranging for the theoretical exchange ratio:
Where:
- : initial oxygen concentration, normally 20.9% for air;
- : residual oxygen in the nitrogen supply;
- : target package oxygen;
- : theoretical gas-exchange ratio.
For nitrogen containing 0.5% O₂ and a package target of 1.0% O₂:
As supply oxygen approaches the package target, the required exchange ratio rises sharply. Production trials can be used to adjust the theoretical value for the actual package and product.
How Much Nitrogen Do Three Typical Packaging Processes Require?
| Design input | Continuously flushed snack bags | Ground-coffee pouches | Vacuum-backfilled cheese trays |
|---|---|---|---|
| Packaging method | Continuous flush | Continuous flush | Vacuum and backfill |
| Effective gas volume | 1.0 L/package | 0.5 L/package | 20 NL/cycle |
| Maximum speed | 80 packs/min × 2 lines | 40 packs/min × 1 line | 12 cycles/min |
| Supply residual oxygen | 0.5% | 0.1% | Defined by gas recipe |
| Package oxygen target | 1.0% | 1.0% | Defined by product trials |
| Theoretical exchange ratio | 3.71 | 3.14 | Cycle-based |
| Peak factor | 1.15 | 1.20 | 1.20 |
| Preliminary nitrogen demand | 41.0 Nm³/h | 4.5 Nm³/h | 17.3 Nm³/h |
| Membrane generator speed | 0 rpm | 0 rpm | 0 rpm |
| Packaging-machine pressure | Approximately 0.4–0.6 MPa(g) | Approximately 0.4–0.6 MPa(g) | Machine-specific |
| Preliminary short-run pipe ID | Approximately 20 mm | Approximately 10–15 mm | Approximately 15 mm |
Final pipe diameter is calculated from pipe length, gas velocity, fittings, filter pressure drop, and allowable pressure loss.
Which Technical Parameters Matter When Selecting a Membrane Nitrogen Generator?
The primary comparison points are nitrogen flow at the specified purity, residual O₂, air-to-nitrogen ratio, outlet pressure, dew point, and specific energy consumption.
How Much Does Flow Decrease When Purity Rises from 95% to 99%?
The following Parker HFX data apply at 20°C and 7 bar(g):
| Model | 95% N₂ | 97% N₂ | 98% N₂ | 99% N₂ | Flow reduction |
|---|---|---|---|---|---|
| HFX-5 | 7.9 Nm³/h | 5.0 Nm³/h | 3.7 Nm³/h | 2.2 Nm³/h | 72.2% |
| HFX-7 | 13.0 Nm³/h | 8.0 Nm³/h | 5.9 Nm³/h | 3.4 Nm³/h | 73.8% |
| HFX-9 | 21.0 Nm³/h | 13.0 Nm³/h | 9.3 Nm³/h | 5.7 Nm³/h | 72.9% |
For the HFX-9, increasing purity from 95% to 99% reduces nominal flow from 21 to 5.7 Nm³/h. Purity, pressure, temperature, and flow should therefore be shown together in a technical comparison.
The HFX range lists a 4–10 bar(g) operating pressure, a nitrogen dew point of −50°C, and 0.01 μm final filtration. Food-packaging systems can specify filtration and dew point according to gas-contact conditions and the site’s HACCP assessment.
How Are Compressor Power and kWh/Nm³ N₂ Calculated?
A membrane module has no rotating shaft. Most system power is consumed by the air compressor, dryer, heater, and gas analyzer.
Where:
- : average input power, kW;
- : compressed-air flow, Nm³/h;
- : compressed-air specific energy consumption, kWh/Nm³.
If the generator requires 90 Nm³/h of compressed air and the compressor consumes 0.105 kWh/Nm³:
The U.S. Department of Energy gives a typical efficiency of approximately 18–19 kW/100 cfm for a single-stage, lubricant-injected rotary screw compressor, equivalent to roughly 0.106–0.112 kWh/m³.
A useful technical comparison includes:
- Nm³ air per Nm³ nitrogen at the specified purity;
- combined compressor and air-treatment input power;
- specific energy consumption in kWh/Nm³ N₂;
- inlet and nitrogen outlet pressures;
- inlet and ambient temperature ranges;
- residual O₂ at minimum, rated, and peak flow.
Which System Configuration Fits the Packaging Plant?
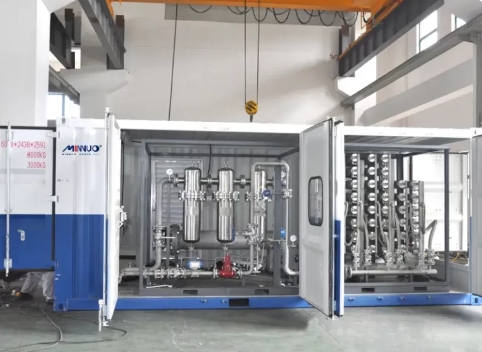
Cabinet systems suit individual packaging lines and point-of-use nitrogen. Skid-mounted systems integrate air treatment, membrane modules, instruments, and controls for centralized multi-line supply. Containerized systems support outdoor installation and plants with limited indoor utility space.
A system such as the MINNUO membrane nitrogen generator combines multistage filtration, compressed-air drying, membrane separation, purity monitoring, and automatic off-spec gas discharge. Its published range covers 5–5,000 Nm³/h and 90%–99.9% nitrogen purity, with cabinet, skid-mounted, and containerized configurations. A downstream booster can be added where the packaging process requires higher nitrogen pressure.
How Should a Food Packaging Membrane Nitrogen System Be Tested?
Acceptance testing should cover the generator outlet, total system energy consumption, and sealed-package performance.
| Test item | Recorded data | Performance indicator |
|---|---|---|
| Nitrogen quality | O₂, flow, temperature, inlet and outlet MPa(g) | Purity stability across the operating range |
| Air-to-nitrogen ratio | Nm³ air/Nm³ nitrogen | Membrane separation efficiency |
| Total energy use | kW, accumulated kWh, accumulated Nm³ N₂ | kWh/Nm³ N₂ |
| Package residual oxygen | O₂ after startup, stable operation, film changes, and product changes | Packaging-process performance |
| Seal integrity | Leak rate, sealing temperature, and sealing pressure | Package integrity |
| Inlet-air quality | Particles, water, oil, and filter differential pressure | Membrane protection |
| Instrument performance | Range, accuracy, response time, and calibration date | Measurement reliability |
ISO 8573-1 expresses compressed-air classes in the order particles, water, and oil. Atlas Copco specifies [1:-:1] for the inlet air of a particular NGMs membrane system; the dash means that no water class is stated in that designation.
Published Parker data provide a useful purity-flow reference: at 7 bar(g) and 20°C, the HFX-9 delivers 21 Nm³/h at 95% N₂ and 5.7 Nm³/h at 99% N₂.
Food Packaging Case Study: How Is the 12-Month Cost Calculated?
Parker reports a U.S. food producer using nitrogen for meal kits, salad kits, snacks, and vegetable packaging. The facility moved from delivered liquid nitrogen to an expandable on-site generation system sized for maximum demand. According to the supplier, annualized savings approached USD 85,000 within the first two years of operation.
The case highlights three economic factors:
- producing nitrogen at the purity required by the packaging process;
- sizing the system for maximum simultaneous demand;
- including delivery, tank rental, and supply-interruption costs.
Twelve-month net savings can be calculated as:
The annual operating report can include:
- total Nm³ N₂ produced;
- total electricity consumption in kWh;
- average kWh/Nm³ N₂;
- residual-oxygen deviations;
- nitrogen-system downtime;
- changes in packaging-material and product losses.
This case illustrates a cost-accounting method and does not imply that every membrane nitrogen project will produce the same savings.
Conclusion: Selecting a Membrane Nitrogen Generator for Food Packaging
A food packaging membrane nitrogen generator should be selected from the required package residual oxygen and peak nitrogen demand. Calculate flow from package headspace, maximum line speed, gas-exchange ratio, and the number of lines operating simultaneously.
Compare systems using nitrogen flow at the specified residual O₂, air-to-nitrogen ratio, outlet pressure, dew point, total input power, specific energy consumption in kWh/Nm³ N₂, and residual oxygen measured in sealed packages.
At MINNUO, we help food processors, packaging facilities, and production plants build reliable on-site nitrogen systems for food packaging. From compact membrane nitrogen generators serving individual packaging lines to large integrated systems supplying multiple production areas, we focus on solutions that support product freshness, packaging consistency, and dependable gas availability. Because in food packaging, every properly protected package helps preserve the quality customers expect.
Food Packaging Membrane Nitrogen Generator FAQ
Q: Why can package oxygen remain high when the generator delivers 99% N₂?
A: The package may still contain original air, porous product, and poorly flushed spaces. If the supply gas contains 1% O₂, the ideal perfectly mixed limit is also 1%. Lower package oxygen can be achieved with purer supply gas, improved nozzle positioning, vacuum backfilling, or multiple gas exchanges.
Q:Should Food Packaging Use Membrane or PSA Nitrogen Generation?
A: Membrane systems are compact, start quickly, and suit moderate-purity or variable-load processes. PSA systems are often more efficient at higher purity. Compare both at the same purity, pressure, temperature, and flow using specific energy, maintenance cost, and installation footprint.
Q:Which Nitrogen Generator Configuration Fits a Food Packaging Plant?
A: Cabinet systems suit individual or low-flow lines. Skid-mounted systems serve centralized multi-line supply. Containerized systems support outdoor installation, rapid deployment, and plants with limited indoor utility space.


 sales2:+86 17506119168